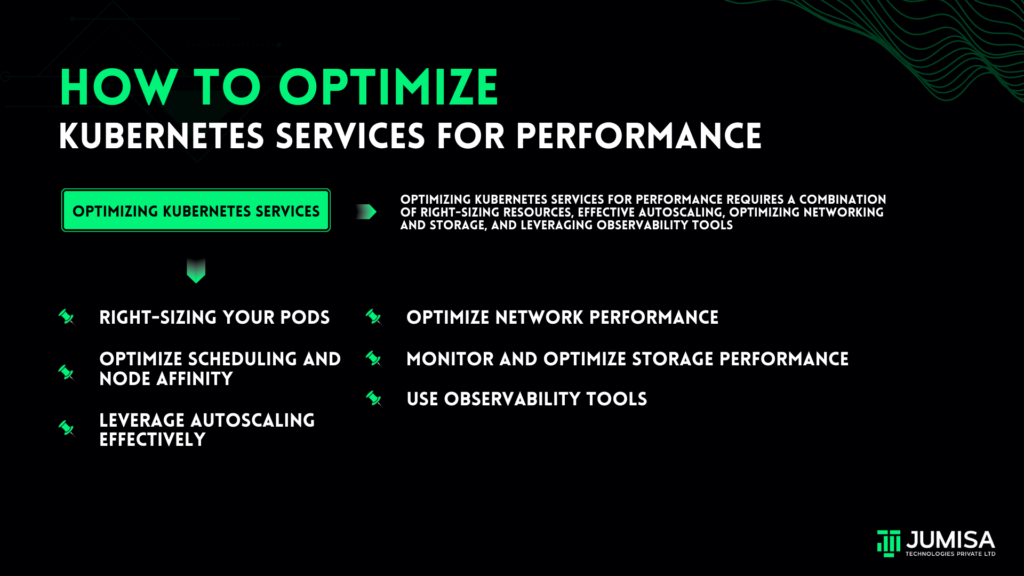
In this blog, we’ll cover the key strategies and practices for optimizing Kubernetes services to maximize performance, minimize latency, and ensure your applications scale smoothly.
1. Right-Sizing Your Pods
One of the fundamental aspects of optimizing Kubernetes performance is ensuring that your pods (the smallest deployable units in Kubernetes) are right-sized. Right-sizing means allocating the appropriate amount of resources to each pod, such as CPU and memory, so that it can handle the workload without over- or under-utilizing resources.
How to Right-Size Pods:
– Resource Requests and Limits: Kubernetes allows you to define resource requests (the minimum guaranteed resources a pod needs) and resource limits (the maximum resources a pod can use). Properly setting these values ensures your application has enough resources to perform well under normal conditions but doesn’t consume more than its fair share during peak loads.
– Monitor Resource Utilization: Use monitoring tools like Prometheus or Kubernetes’ built-in metrics server to track the actual resource usage of your pods. Based on this data, adjust your requests and limits for future deployments.
– Autoscaling: Configure Horizontal Pod Autoscalers (HPA) to dynamically adjust the number of running pods based on real-time resource usage (such as CPU or memory). This prevents over-provisioning or under-provisioning of resources, which can affect both cost and performance.
2. Optimize Scheduling and Node Affinity
Kubernetes schedules pods across a cluster of nodes. Optimizing how and where pods are scheduled can greatly impact performance.
Key Strategies for Optimizing Scheduling:
– Pod Affinity and Anti-Affinity: By setting affinity and anti-affinity rules, you can control which nodes or other pods your workloads are deployed near or far from. For example, if you want two pods to run on separate nodes for redundancy, you can set anti-affinity rules to avoid co-locating them. Conversely, you might want two pods that communicate frequently to be located close to each other to reduce network latency.
– Node Taints and Tolerations: Taints and tolerations allow you to isolate certain workloads to specific nodes. For example, if you have nodes with high-performance hardware (such as GPUs), you can “taint” those nodes so that only pods with matching tolerations (e.g., AI/ML workloads) can run on them.
– Custom Scheduling Policies: You can create custom scheduling policies to ensure that Kubernetes takes application-specific factors (e.g., latency sensitivity or throughput needs) into account when scheduling pods.
3. Leverage Autoscaling Effectively
Kubernetes offers several autoscaling features, but optimizing their usage is critical to achieving peak performance and cost-efficiency.
Types of Autoscaling:
– Horizontal Pod Autoscaler (HPA): HPA automatically increases or decreases the number of pods based on observed metrics, such as CPU utilization or custom metrics (e.g., request rate). It’s important to tune your HPA settings to trigger scaling actions at the right thresholds.
– Vertical Pod Autoscaler (VPA): VPA automatically adjusts the CPU and memory requests of pods. This can be useful if your application has variable resource needs, such as during different times of day. However, you need to be cautious with VPA, as adjusting resource limits too frequently can lead to pod restarts, which may negatively impact performance.
– Cluster Autoscaler: This scales the number of nodes in your cluster based on the resource needs of the pods. For example, if your workload increases and there aren’t enough nodes, Cluster Autoscaler will automatically provision additional nodes.
Tips for Effective Autoscaling:
– Set realistic thresholds for scaling up or down, keeping in mind the latency between the trigger and the actual scaling action.
– Monitor the performance of autoscalers regularly to ensure they respond promptly to changes in workload demands.
– Ensure that your applications can handle traffic spikes gracefully by incorporating readiness and liveness probes.
4. Optimize Network Performance
Networking is a critical part of Kubernetes performance optimization. Poorly optimized network configurations can lead to latency issues, packet loss, and overall slower service delivery.
Ways to Optimize Kubernetes Networking:
– Network Policies: Define Kubernetes Network Policies to control the flow of traffic between pods and external services. This not only secures your application but also improves performance by limiting unnecessary network traffic.
– Service Mesh: Deploy a service mesh (e.g., Istio, Linkerd) to handle service-to-service communications efficiently. Service meshes provide advanced traffic routing, load balancing, and observability, ensuring that requests between services are handled optimally.
– Load Balancing: Ensure that you are using appropriate load balancers (e.g., Kubernetes’ built-in services like ClusterIP, NodePort, and LoadBalancer) for distributing traffic. For large-scale applications, consider using an external load balancer or ingress controller to manage external requests more efficiently.
– Reduce Latency: Use proximity-based scheduling or regional clustering to place services close to end users, minimizing latency for real-time applications.
5. Monitor and Optimize Storage Performance
Storage is another key area that impacts Kubernetes service performance, particularly for applications with high I/O demands such as databases or analytics workloads.
Tips for Optimizing Storage:
– Use the Right Storage Classes: Kubernetes supports different types of storage classes (e.g., SSDs for high I/O performance or HDDs for large volumes of data). Ensure that you are using the appropriate storage class for your workload.
– Persistent Volumes: Properly configure Persistent Volumes (PVs) to meet your application’s storage requirements. Ensure that they are accessible and provide the necessary read/write speeds to prevent bottlenecks.
– StatefulSets: For stateful applications, use StatefulSets to manage the state and persistent storage in a more controlled and reliable manner. This ensures consistent network identities and storage access across pod restarts.
6. Use Observability Tools
Observability is essential for understanding how your Kubernetes services are performing and identifying areas for optimization.
Key Observability Tools:
– Prometheus and Grafana: Use these for monitoring resource usage, tracking performance metrics, and visualizing data in dashboards. They can also alert you to performance issues such as high CPU usage, memory leaks, or pod restarts.
– Jaeger and Zipkin: These tools help with distributed tracing, allowing you to track how requests flow through different microservices in your Kubernetes cluster. This can help identify bottlenecks in your application architecture.
– Kubernetes Metrics Server: This lightweight tool aggregates resource metrics like CPU and memory utilization, helping you optimize pod allocation and resource usage in real time.
Conclusion
Optimizing Kubernetes services for performance requires a combination of right-sizing resources, effective autoscaling, optimizing networking and storage, and leveraging observability tools. By following these best practices, you can ensure that your Kubernetes workloads are running at peak performance, minimizing costs while maintaining high availability and responsiveness. Regular monitoring and tuning will help you stay ahead of any potential issues and keep your applications running smoothly as they scale.

