,

AWS Monitoring and notification using CloudWatch, Lambda, and SNS

experts in Cloud Computing, Managed DevOps, and Kubernetes Services.

Table of Contents

Use case

  • A business is running its critical applications on multiple EC2 instances. The CloudWatch logs are enabled.
  • It is required to monitor and notify its users regarding any errors.
  • The errors are rarely expected, but the notification must be sent instantly for any error occurrence.
  • The notification must include details such as the error log, time of the error, and instance ID.
  • The solution is required using CloudWatch, Lambda, and SNS.

Solution implemented

  • Install CloudWatch agent on the instance that is to be monitored.
  • Collect the application logs in a CloudWatch log group.
  • Create an SNS topic and add email subscriptions.
  • Create a Lambda function that is triggered by the CloudWatch metric filter
  • Program the lambda function using Python to filter the error message, and send an email using the SNS with the query results.

Prerequisites

To demonstrate the proposed solution the below mentioned architecture must be provisioned.

  • Create an IAM role that enables the log to populate in the CloudWatch log group.
  • Create a public EC2 instance where a web application is running with the IAM role attached.
  • Install and configure the CloudWatch agent in the instance.
  • Create a SNS topic and add the user email to the topic subscription.
  • Create a Lambda function and set the trigger as the CloudWatch metric filter.
  • Use Python code to filter the log and send an email via SNS with the error log.

IAM Role

Create an IAM role as shown in the image below, which has permissions to write logs to AWS CloudWatch.

experts in Cloud Computing, Managed DevOps, and Kubernetes Services.

There is an AWS managed policy CloudWatchAgentServerPolicy which has the necessary permissions to bring the logs from the EC2 instance to CloudWatch.

AmazonSSMManagedInstanceCore is the policy that enables an instance to use Systems Manager service core functionality.

Install Apache HTTP server on an EC2 instance

Create a public EC2 instance with the IAM role attached to it as shown in the image below.

experts in Cloud Computing, Managed DevOps, and Kubernetes Services.

Once the instance is launched, login to the CLI, install the Apache server and run the following command to configure the Apache HTTP server.

				
					sudo nano /etc/httpd/conf/httpd.conf


Modify the line ErrorLog “logs/error_log” into ErrorLog “/var/log/www/error/error_log”

Modify the line CustomLog “logs/access_log” into CustomLog “/var/log/www/access/access_log”

If the directories are not already present, please create them.

Once the configuration is completed, start the HTTP server by running the following command.

sudo systemctl start httpd

Now, upon checking the url http://<public_ip> , we can see the apache test page on the browser

experts in Cloud Computing, Managed DevOps, and Kubernetes Services.

Install and configure CloudWatch Agent

On all supported operating systems, the CloudWatch agent can be downloaded and installed using the command line.


  1. Install the CloudWatch agent

sudo yum install amazon-cloudwatch-agent

  1. Start the agent configuration wizard

sudo /opt/aws/amazon-cloudwatch-agent/bin/amazon-cloudwatch-agent-config-wizard

  1. Accept all the default choices until the wizard asks you if you want to monitor metrics from CollectD, select 1. Yes only if you have already installed CollectD.
  2. Continue accepting the default choices until it prompts you for a value for the log file path. Specify the log file path as /var/log/www/error/* where the Apache logs will be stored.
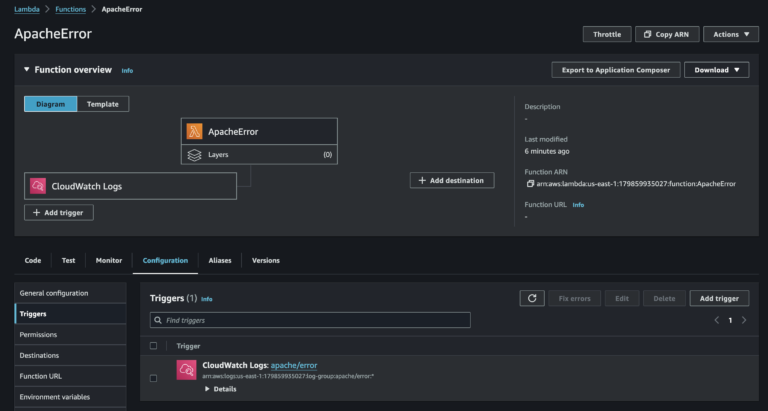
  3. Specify the log group name as apache/error
  4. Select the default option for the log stream name. It will be the instance ID.
  5. Similarly, add an additional log file path /var/log/www/access/*, specify the log stream name apache/access and the same default log stream name.
  6. When there are no additional log files to be added choose option 2 No.
  7. When the wizard prompts you to store the configuration in the AWS Systems Manager Parameter Store,
    • Choose 1. Yes. to centralize the storage of the configuration file using Systems Manager.
    • choose 2. No to utilize both Systems Manager and Parameter Store to centralize installation and configuration at the bulk of the CloudWatch Agent using Systems Manager.

The configuration file will look like

				
					{
        "agent": {
                "metrics_collection_interval": 60,
                "run_as_user": "root"
        },
        "logs": {
                "logs_collected": {
                        "files": {
                                "collect_list": [
                                        {
                                                "file_path": "/var/log/www/error/*",
                                                "log_group_name": "apache/error",
                                                "log_stream_name": "{instance_id}",
                                                "retention_in_days": -1
                                        },
                                        {
                                                "file_path": "/var/log/www/access/*",
                                                "log_group_name": "apache/access",
                                                "log_stream_name": "{instance_id}",
                                                "retention_in_days": -1
                                        }
                                ]
                        }
                }
        },
        "metrics": {
                "aggregation_dimensions": [
                        [
                                "InstanceId"
                        ]
                ],
                "append_dimensions": {
                        "AutoScalingGroupName": "${aws:AutoScalingGroupName}",
                        "ImageId": "${aws:ImageId}",
                        "InstanceId": "${aws:InstanceId}",
                        "InstanceType": "${aws:InstanceType}"
                },
                "metrics_collected": {
                        "disk": {
                                "measurement": [
                                        "used_percent"
                                ],
                                "metrics_collection_interval": 60,
                                "resources": [
                                        "*"
                                ]
                        },
                        "mem": {
                                "measurement": [
                                        "mem_used_percent"
                                ],
                                "metrics_collection_interval": 60
                        },
                        "statsd": {
                                "metrics_aggregation_interval": 60,
                                "metrics_collection_interval": 10,
                                "service_address": ":8125"
                        }
                }
        }
}


SNS

Create a standard SNS topic named ApacheError.

experts in Cloud Computing, Managed DevOps, and Kubernetes Services.

Select the notification protocol as email and add the email address to the SNS subscriptions.

Additionally, there are various types of notification supported by SNS such as SMS, Email-JSON, Platform Application Endpoint, etc.,

experts in Cloud Computing, Managed DevOps, and Kubernetes Services.

After creating subscription, an email confirmation is needed. The user will receive an email from AWS as shown below.

experts in Cloud Computing, Managed DevOps, and Kubernetes Services.

The subscription can be confirmed by clicking the link in the email.

Lambda

Now, let us create a Lambda function. Choose the option Author from scratch.

Name the lambda function and choose an appropriate runtime.

Lambda supports a wide range of runtimes. In this demo, we are going to build the function with Python. The version of Python used is 3.12.

experts in Cloud Computing, Managed DevOps, and Kubernetes Services.

Trigger

Once the lambda is created, the Trigger must be set.

To add a trigger, click on the Add trigger button and choose the trigger type.

Since we have our source from the CloudWatch, CloudWatch Metric Filter, can be used as a trigger for the lambda.

The CloudWatch log group we created apache/error will serve as the event source.

The filter can be named accordingly, and the filter pattern must be the keyword that will be found in the log events.

experts in Cloud Computing, Managed DevOps, and Kubernetes Services.


IAM Role

The Lambda function must be granted permission to access the CloudWatch Logs, and the SNS topic.

On the configurations tab in permissions, we can see an IAM role created and attached for the Lambda function.

experts in Cloud Computing, Managed DevOps, and Kubernetes Services.

For accessing the SNS topic, the policy AmazonSNSFullAccess can be attached to the role.

To access the CloudWatch logs, a custom manager policy is used. The JSON of the policy will be as follows.

				
					{
    "Version": "2012-10-17",
    "Statement": [
        {
            "Effect": "Allow",
            "Action": "logs:CreateLogGroup",
            "Resource": "arn:aws:logs:us-east-1:179859935027:*"
        },
        {
            "Effect": "Allow",
            "Action": [
                "logs:CreateLogStream",
                "logs:PutLogEvents",
                "logs:FilterLogEvents",
                "logs:StartQuery",
                "logs:GetQueryResults"
            ],
            "Resource": [
                "arn:aws:logs:us-east-1:179859935027:log-group:apache/error:*"
            ]
        }
    ]
}


Function

Here comes the most important part of the process.

Below is the Python code that is used to read the CloudWatch logs, filter them, and send an email via SNS with the error logs attached to it.

The function will filter the logs that are created within 5 minutes before the current time and contain the specified keyword. The keyword in our case is “error”

				
					# Import the necessary libraries required for the python code.

import json 
import boto3 
import datetime
from datetime import datetime, timedelta
from dateutil.parser import parse
import time

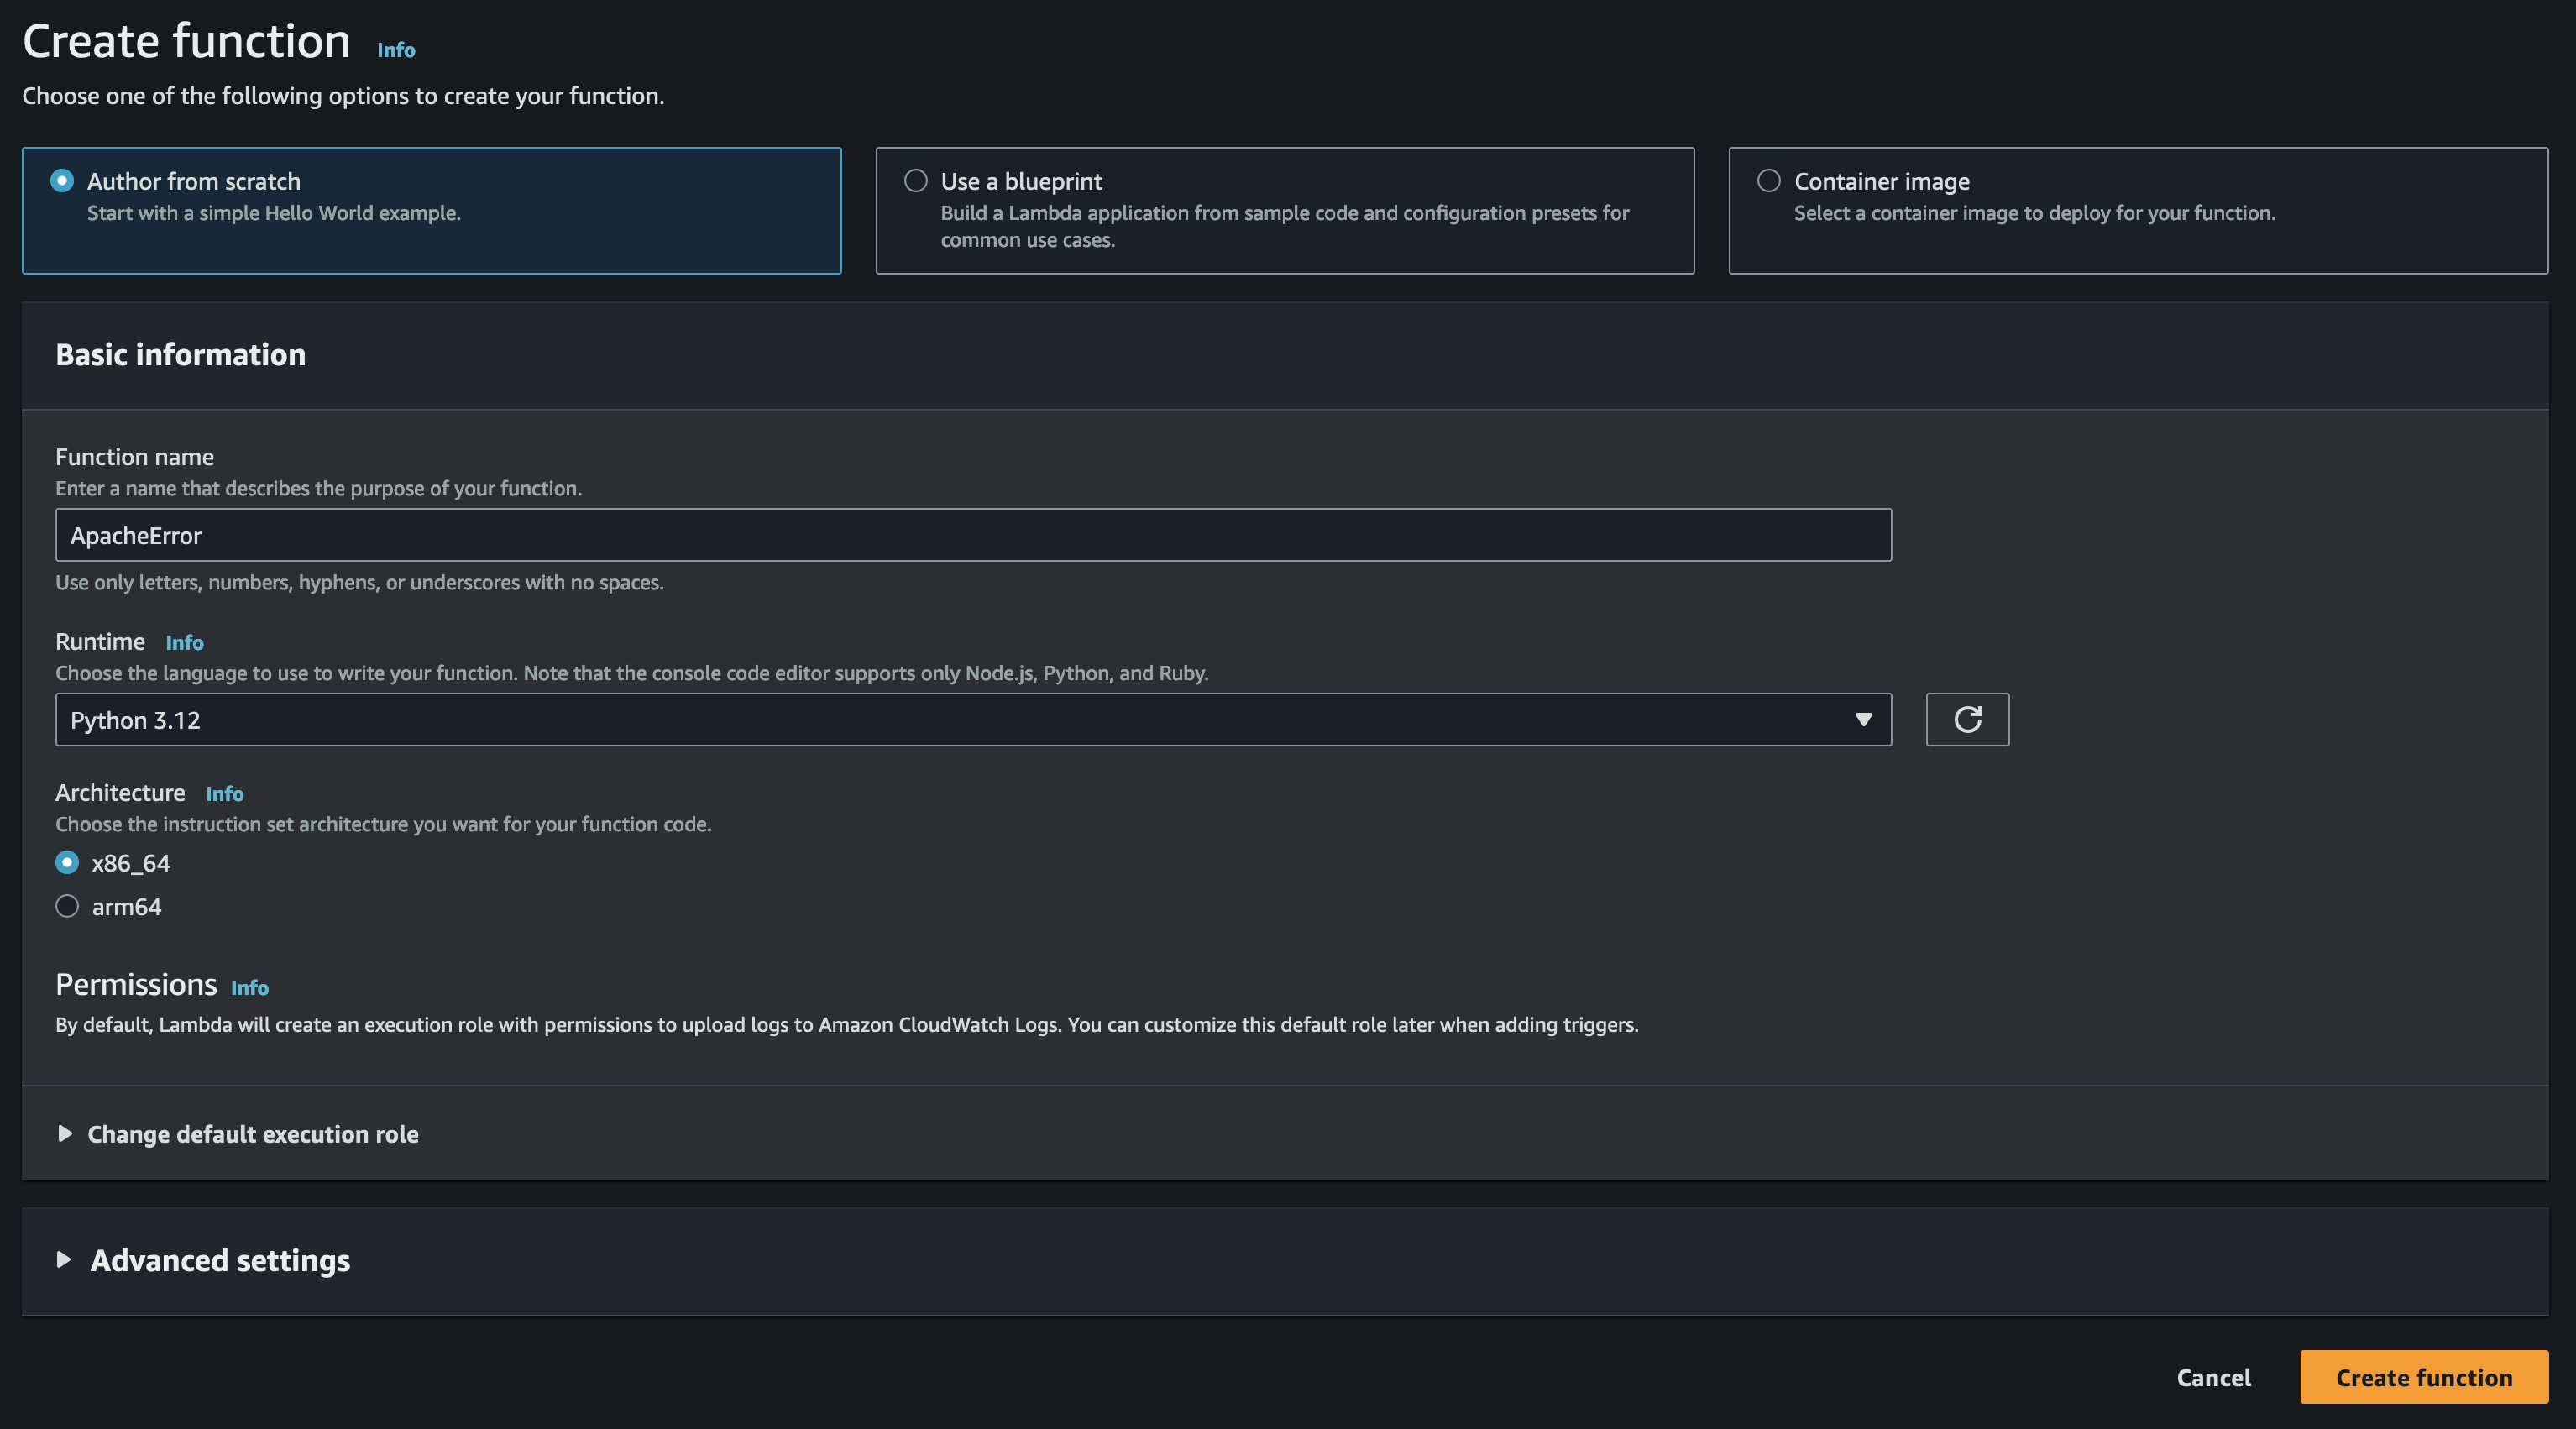
def lambda_handler(event, context):
    try:

# Replace the values for the variables according to the actual infrastructure.

        logGroup  = '/aws/log_group'
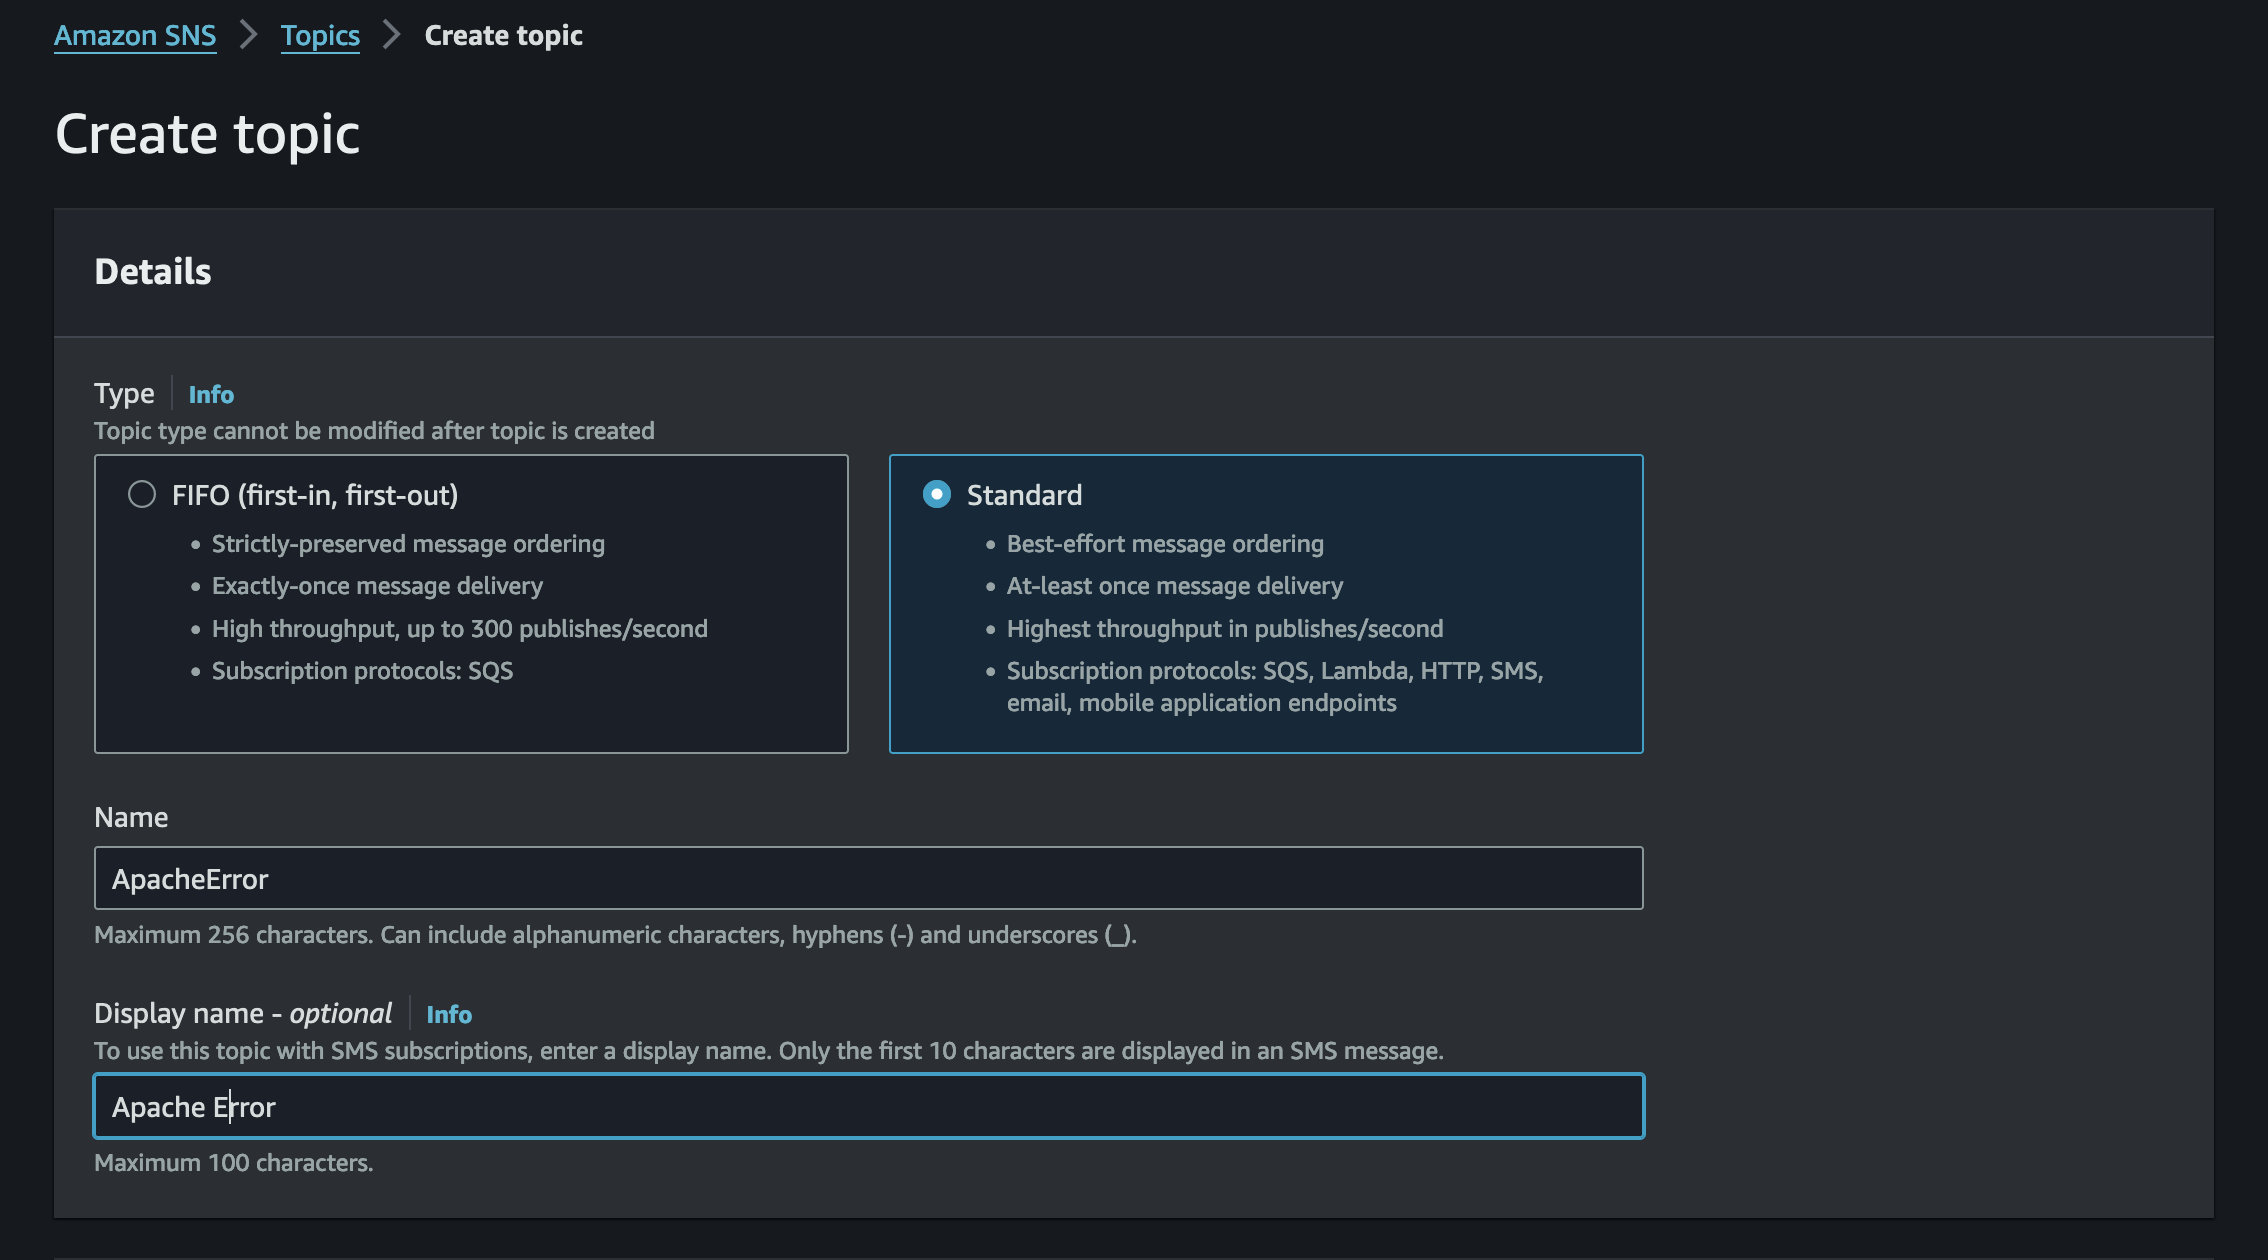
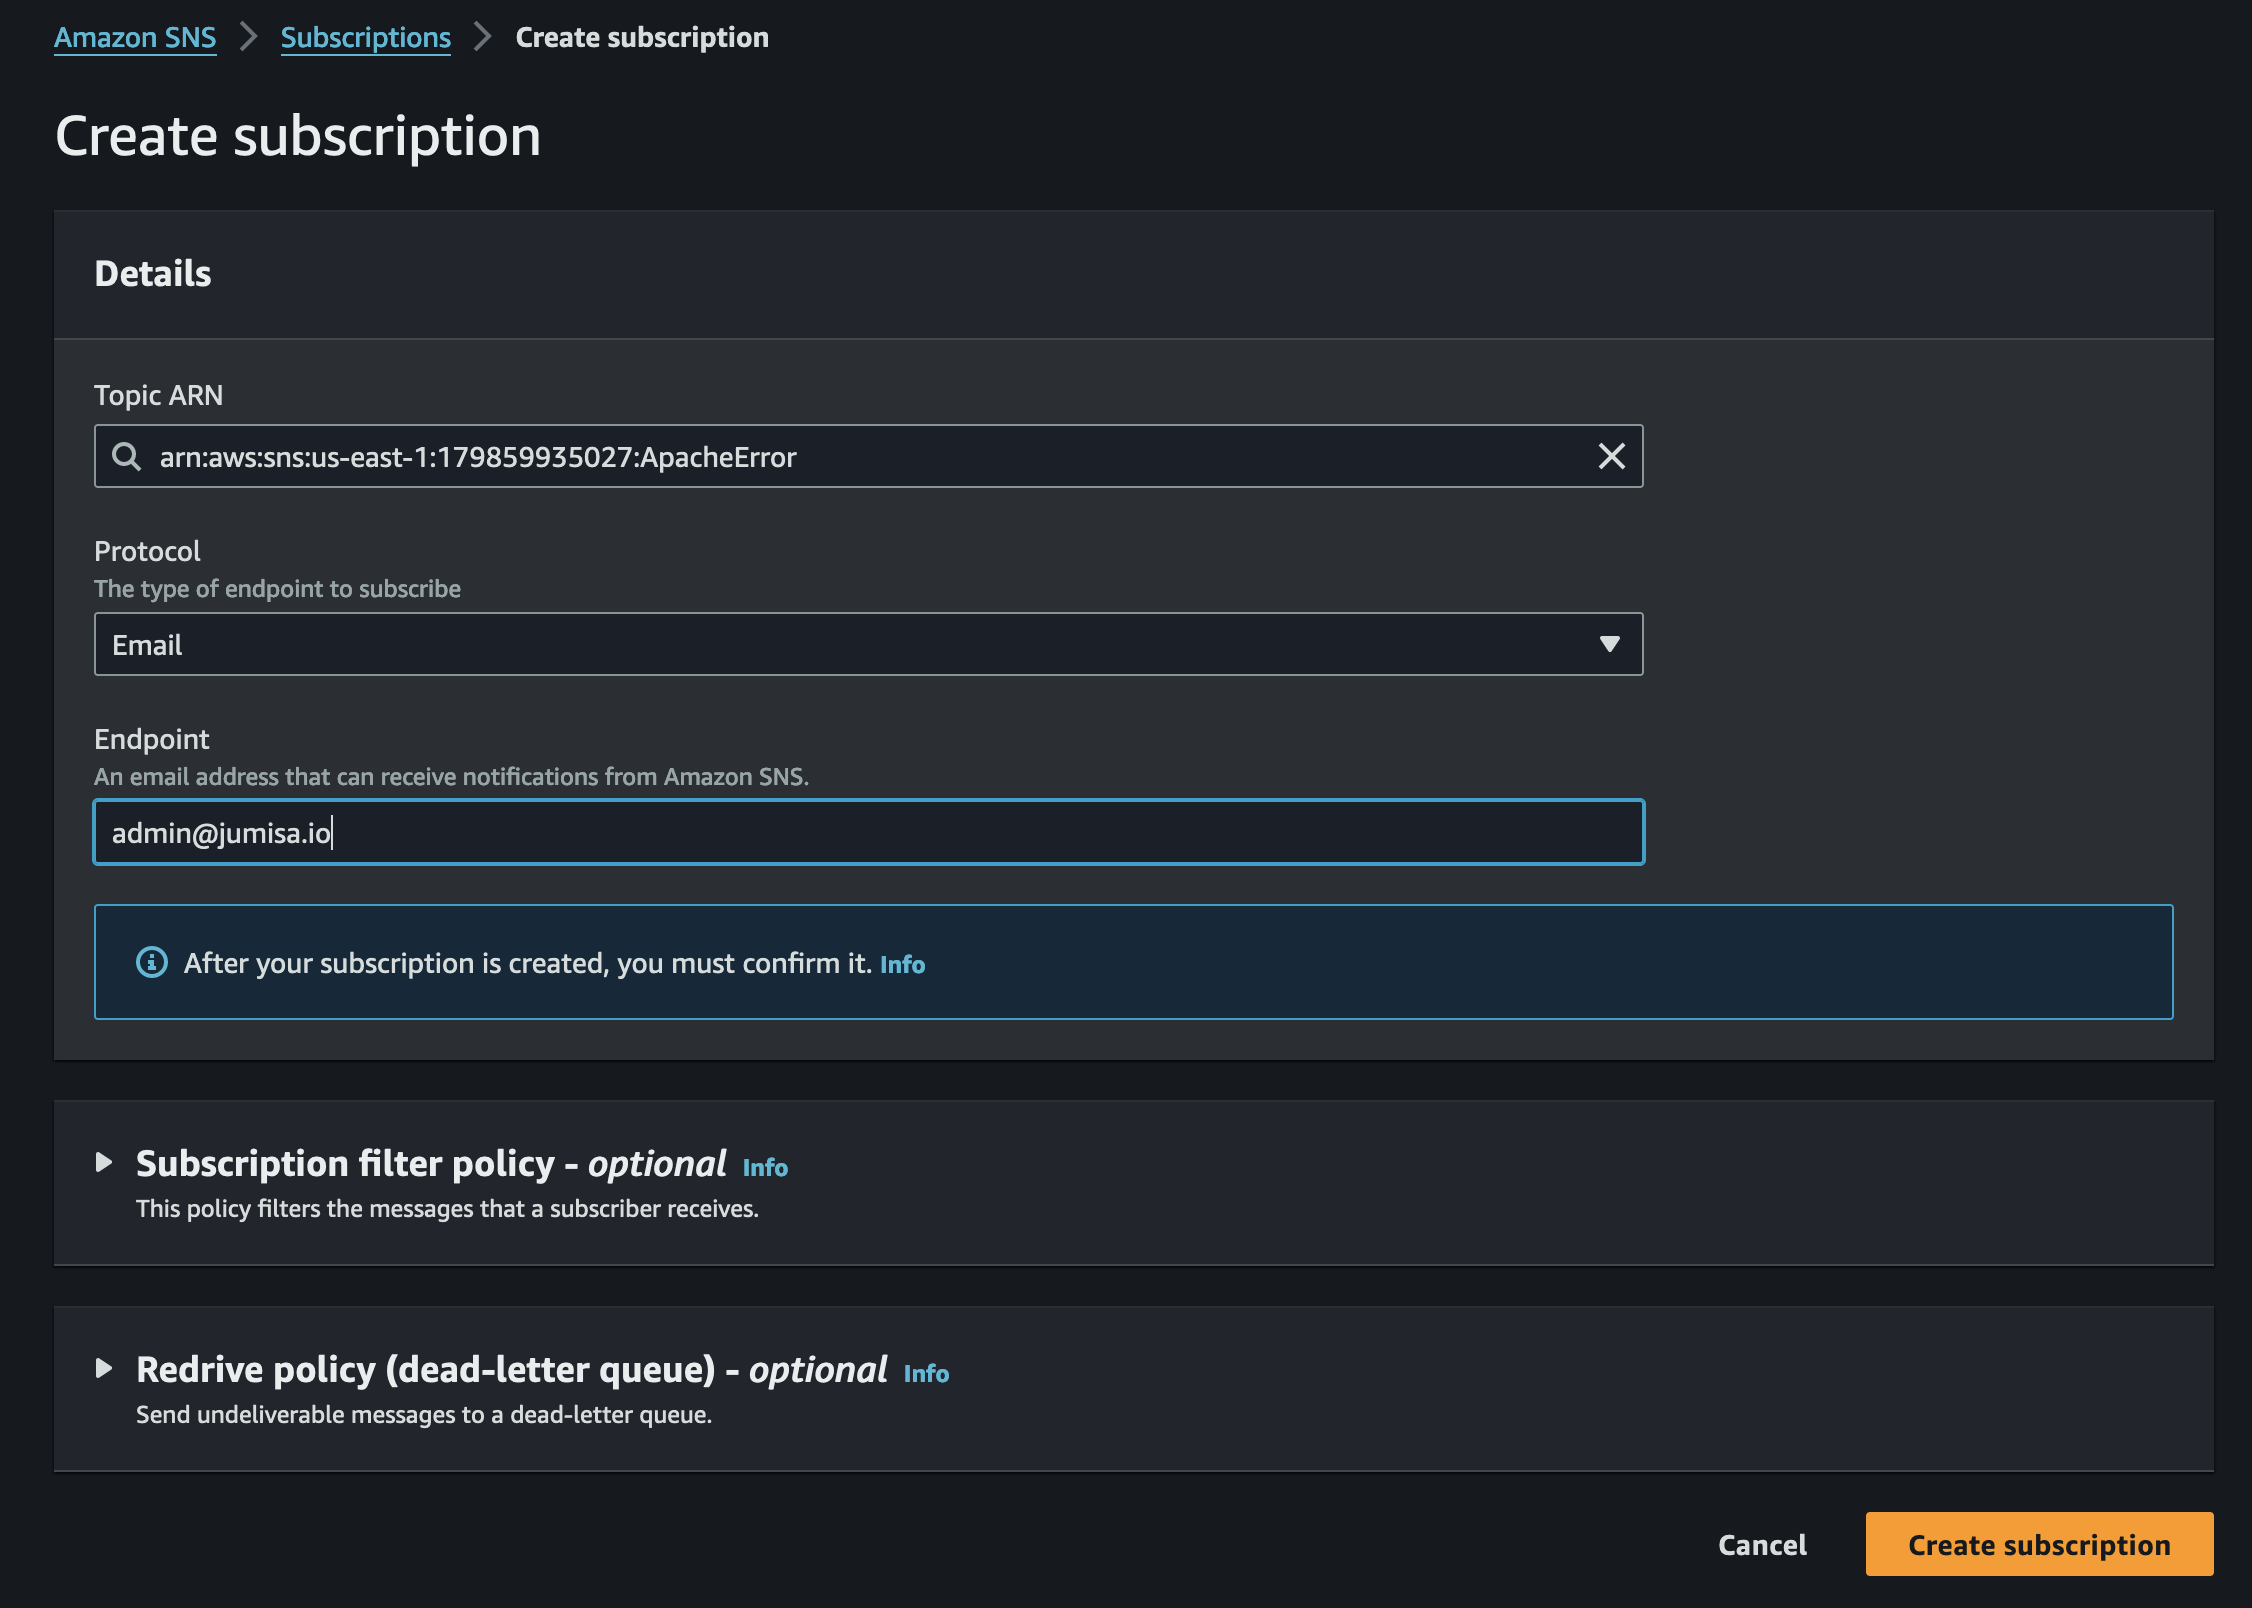
        topicArn      = 'arn:aws:sns:us-east-1:123456789012:snstopic'
        subject       = 'Email Subject'
        queryString   = '?search keyword'
        notification  = True
        flag = True
        token=''
        
# t0 is the current time and t1 is 5 minutes before the current time.

        t0 = datetime.now()
        t1 = datetime.now() - timedelta(minutes=1)
        
# Convert the time in iso format

        def default(o):
            if isinstance(o, (datetime.date, datetime.datetime)):
                return o.isoformat()
                
# Convert the time to epoch format

        def convertToMil(value):
            dt_obj = datetime.strptime(str(value),'%Y%m%d%H%M%S')
            result = int(dt_obj.timestamp())
            return result
            
# Convert the time to human readable format

        def epoch2human(epoch):
          return time.strftime('%Y-%m-%d %H:%M:%S', 
                 time.localtime(int(epoch)/1000.0)) 
                 
# Assign start and end time for the query

        timestamp = t1.strftime("%Y%m%d%H%M%S")
        starttime = convertToMil(str(timestamp))
        currentdateTime = t0.strftime("%Y%m%d%H%M%S")
        endtime = convertToMil(str(currentdateTime))
        
# Filter the logs between the time window and containing the keyword

        client = boto3.client('logs')
        response = client.filter_log_events(
            logGroupName= logGroup,
            startTime=starttime*1000,
            endTime=endtime*1000,
            filterPattern=queryString,
            interleaved=True,
        )

# The queried result will be in JSON format. Hence Parse the result on order to read the contents.

        data = json.dumps(response, indent=2, default=default)
        parsed_data = json.loads(data)

# For the variable Message, assign the  value from the query result.

        message = [event["message"] for event in parsed_data["events"]]
        MESSAGE = [str(elem) for elem in message]

# If there is at least one log event matches the filter query then send email using SNS.
# If no logs events match the filter query, print “The list is empty”.

        snsClient= boto3.client('sns')
        if 'error' in data:
         response = snsClient.publish(
             TopicArn=topicArn,
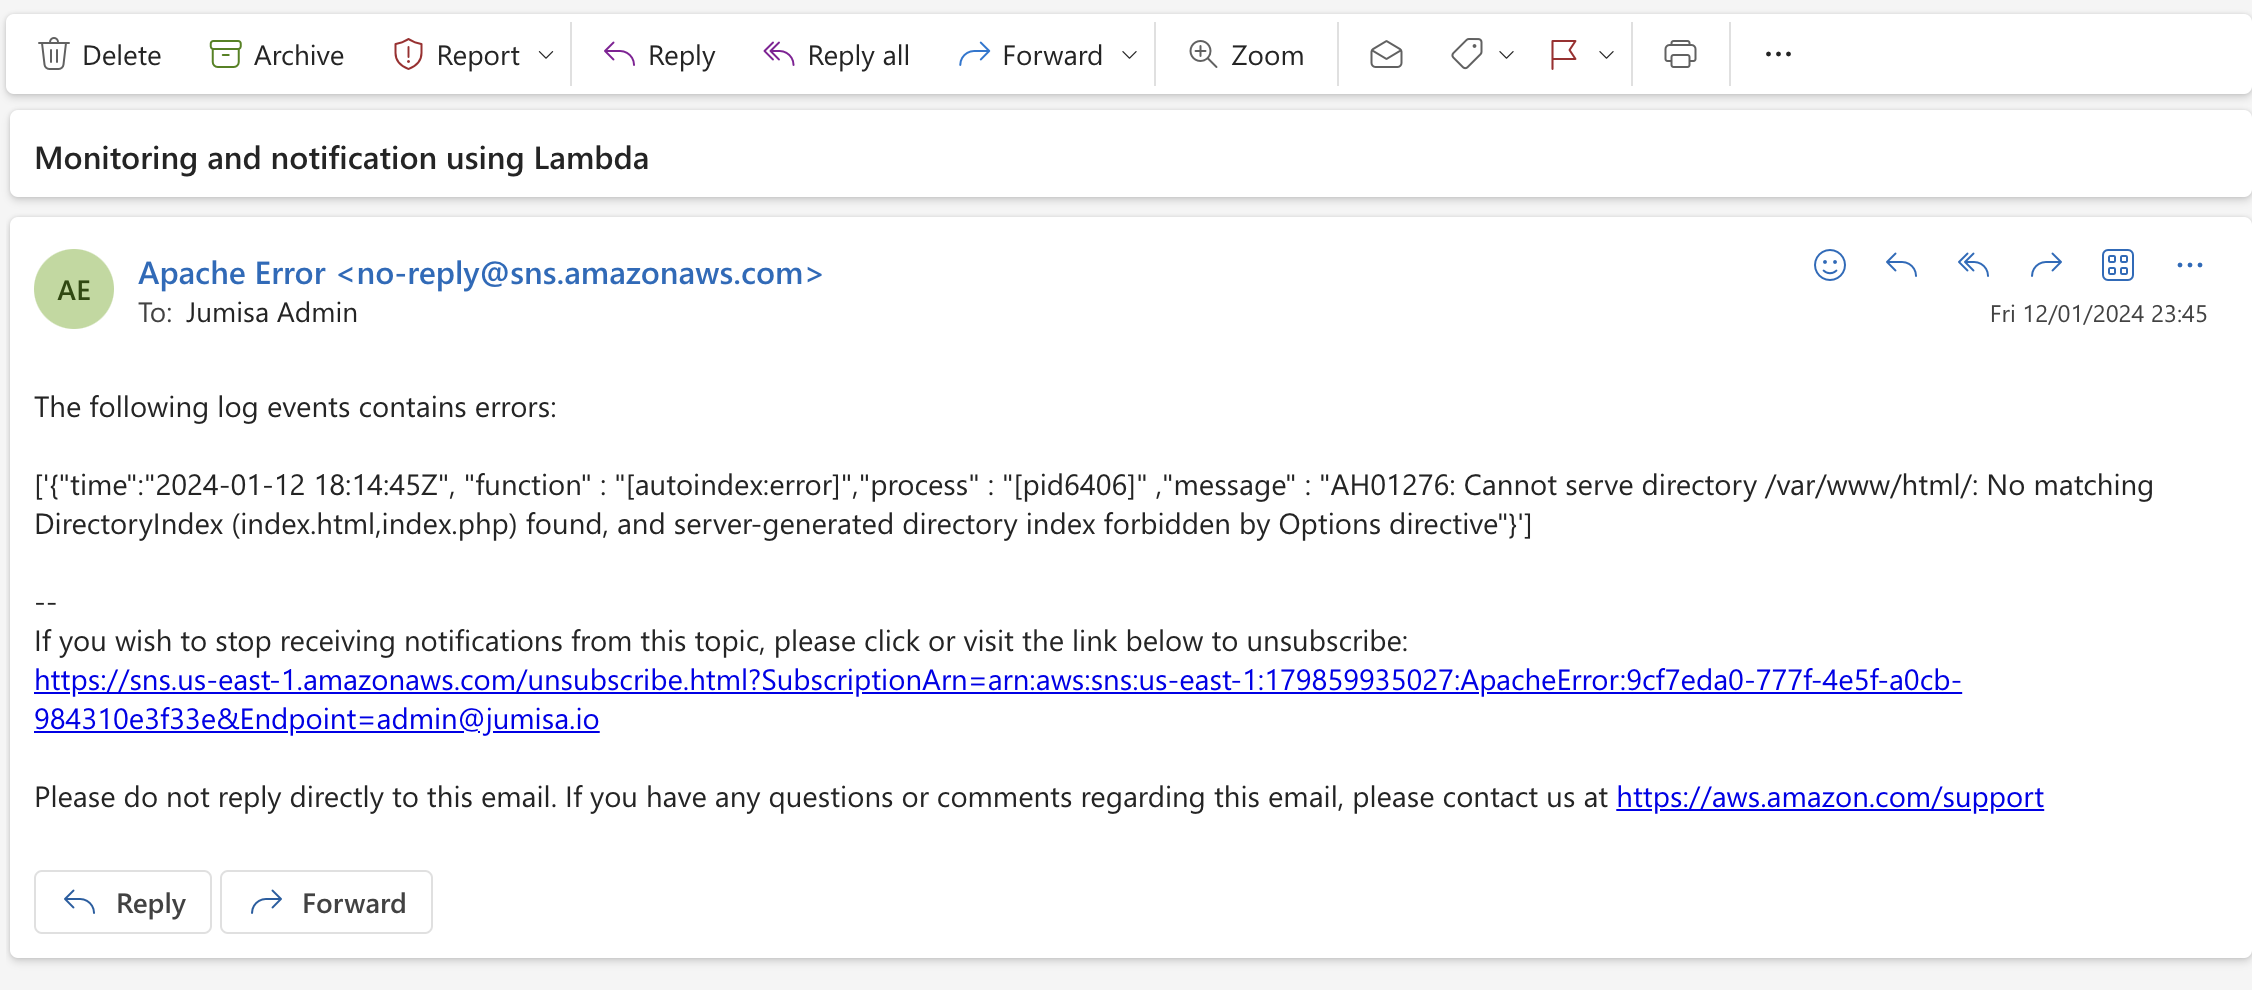
             Message="The following log events contains errors:\n\n" + str(MESSAGE),
             Subject=subject,
             );
        else:
         print("The List is empty.")

# If the code is executed without any error, then print “Successfully executed the function “

        return {
            'StatusCode': 200,
            'Message': 'Successfully executed the function '
        }

# If code is exited due to any error, then print “Something went wrong, please investigate”

    except Exception as e:
        return {
            'StatusCode': 400,
            'Message': 'Something went wrong, Please Investigate. Error --&gt; '+ str(e)
        }


The email that is received for a matching log event.

experts in Cloud Computing, Managed DevOps, and Kubernetes Services.

Conclusion

If you are someone who is looking for an AWS-only solution without using any open-source or third-party tools due to security reasons, then this solution is for you.

The solution we discussed in this blog can also be achieved using other open-source third-party tools such as Prometheus, Grafana, NewRelic DataDog, etc.

Let us explore more about those tools in our future posts.

We highly appreciate your patience and time spent reading this article.

Stay tuned for more Content.

Happing reading !!! Let us learn together !!!

Author

  • Prabhu RP

    Lead DevOps | Cloud Associate Solution Architect |...

2 Responses

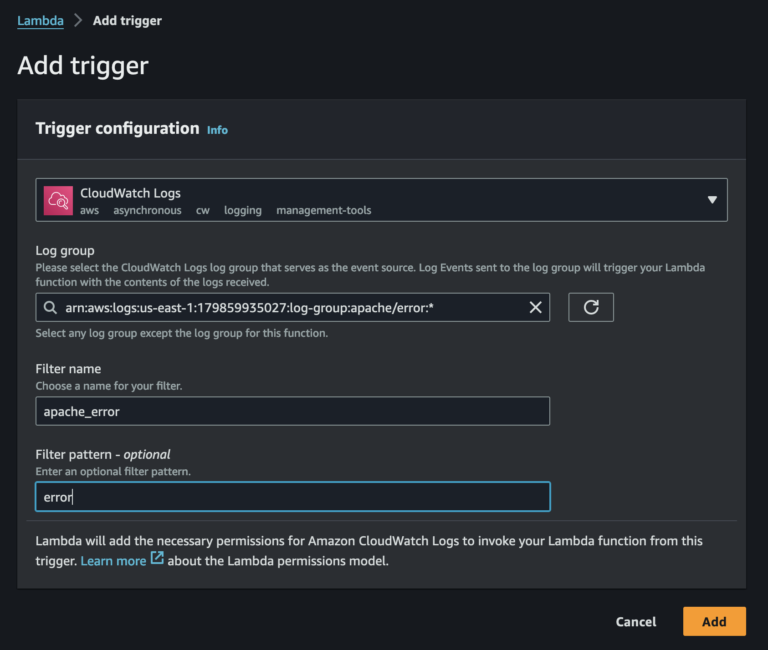
  1. Each error that matches the filter pattern in the CloudWatch Logs subscription will trigger a new invocation of the Lambda function?

Leave a Reply

Your email address will not be published. Required fields are marked *

Related post